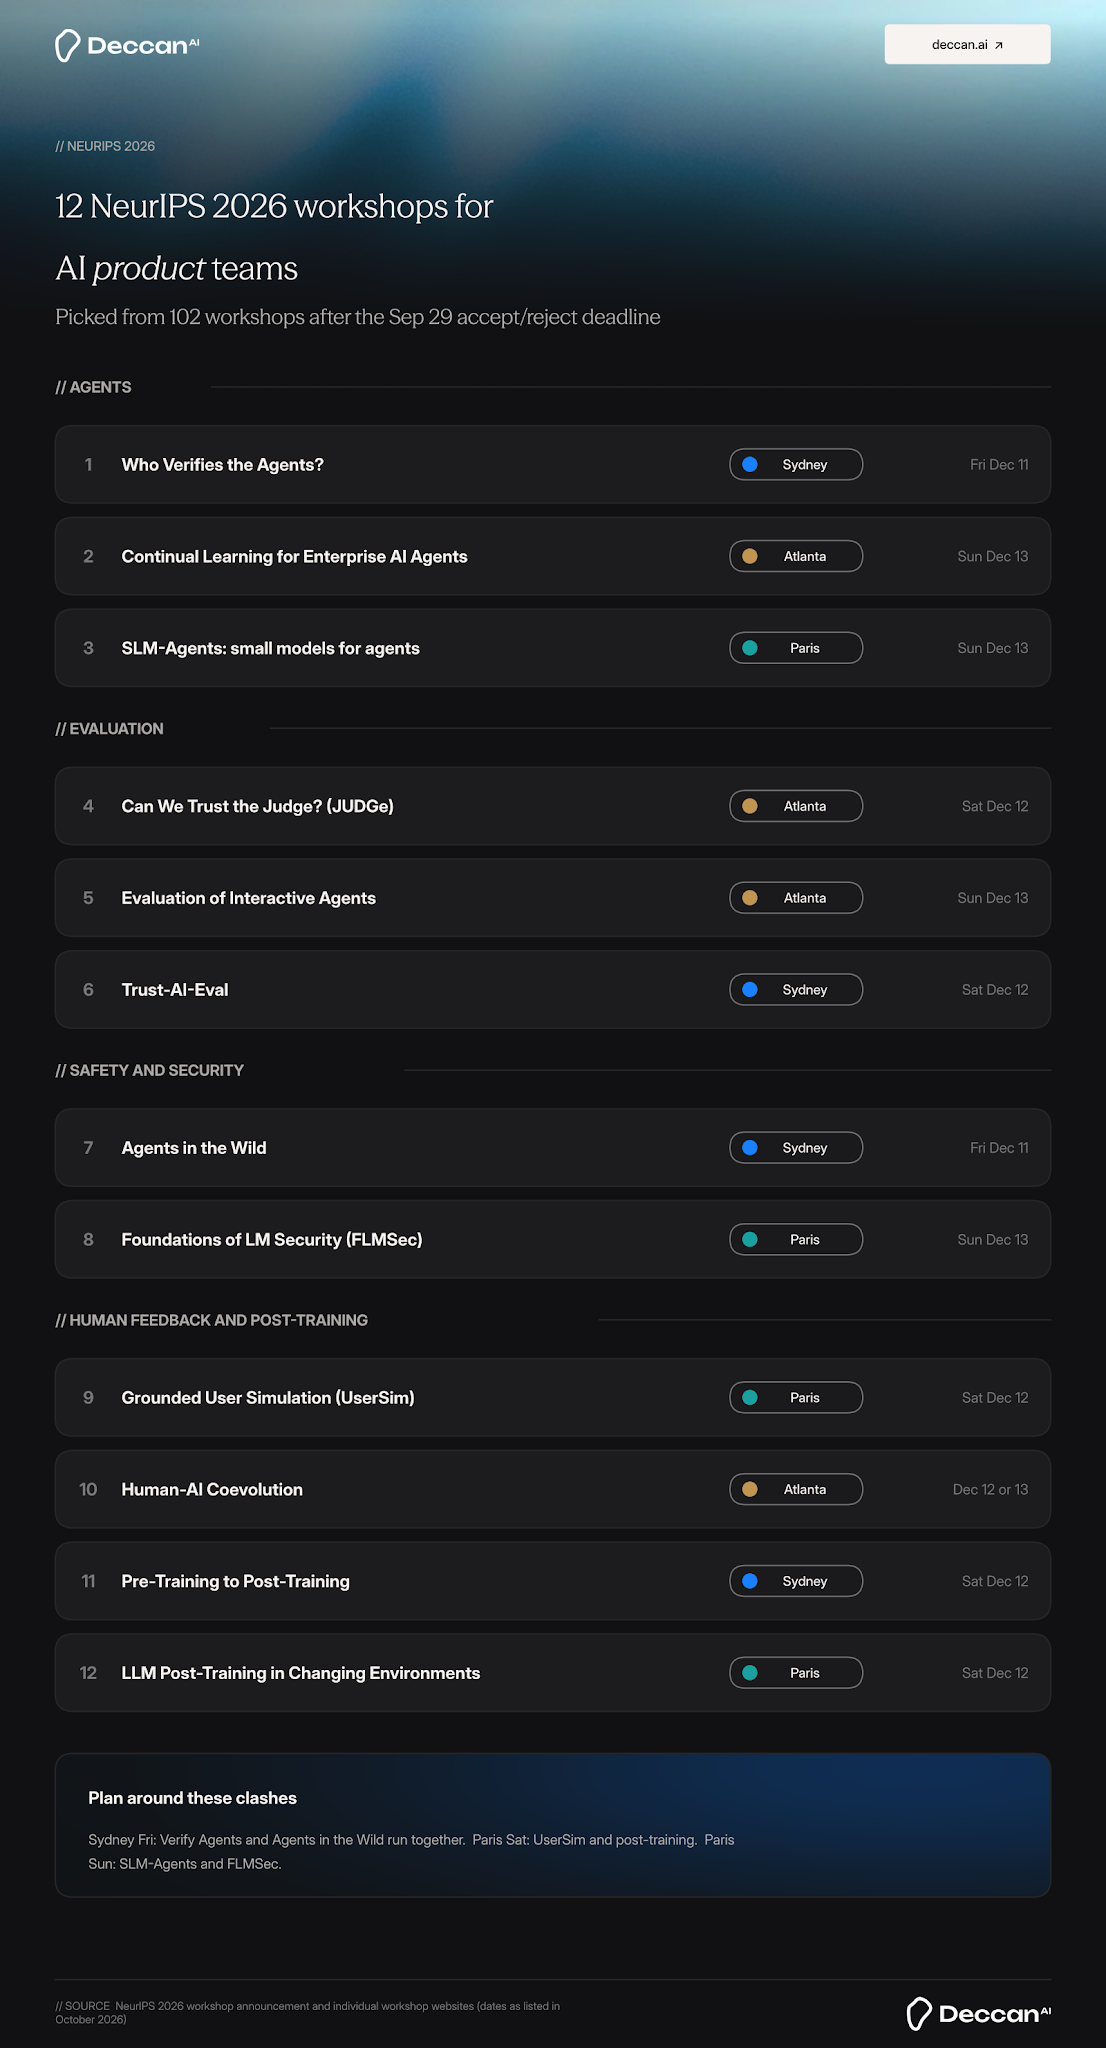
NeurIPS 2026 has 102 workshops spread across Sydney, Atlanta, and Paris, and the selection data the organizers published says a lot about where the field is putting its energy. Here are the numbers that matter, starting with the five biggest, followed by what they mean if you are choosing which city to attend.
The five headline numbers
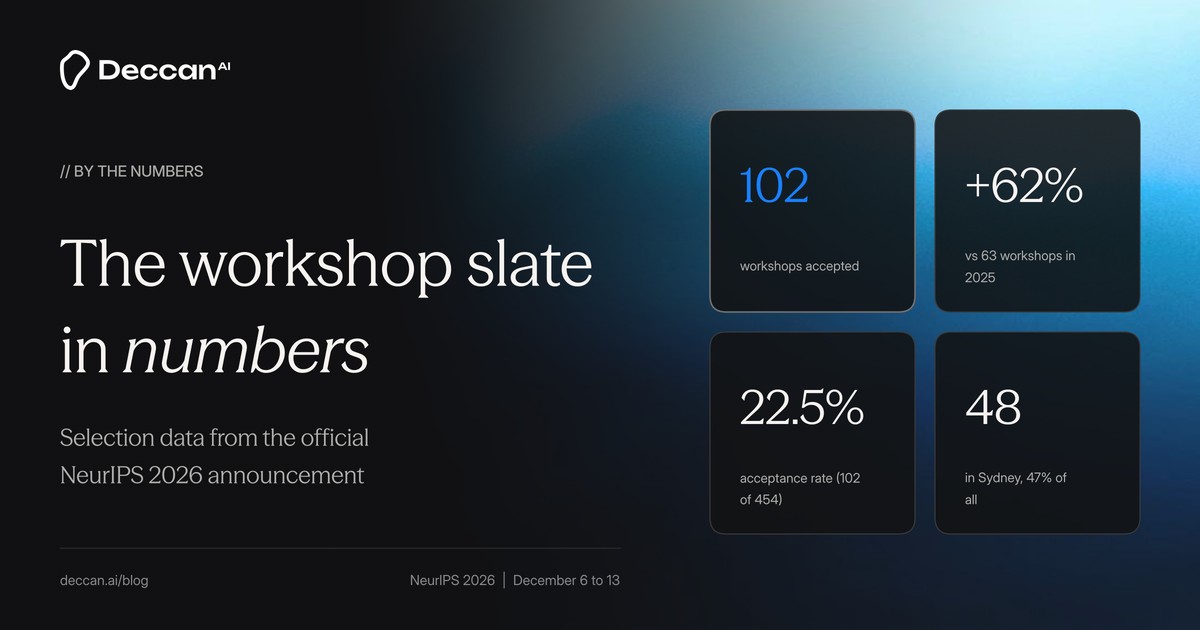
102 workshops
NeurIPS accepted 102 workshops for 2026: 48 in Sydney, 28 in Paris, and 26 in Atlanta. Sydney runs its workshops on December 11 and 12. Paris and Atlanta run theirs on December 12 and 13.
62% more than last year
NeurIPS 2025 had 63 workshops, 55 in San Diego and 8 at its Mexico City site, according to the official 2025 fact sheet. Going from 63 to 102 is a 62% jump in one year. For comparison, main-track submissions grew about 38% between 2024 and 2025, by IntuitionLabs' figures. The workshop program is growing faster than the conference around it.
22.5% acceptance
The workshop committee received 477 proposals, of which 454 were valid, and accepted 102. That is a 22.5% acceptance rate. Third-party trackers put the 2026 main-track paper acceptance rate at about 25.7%. If those figures hold, getting a workshop accepted was slightly harder than getting a paper in.
48 in Sydney
Sydney hosts 47% of all workshops, close to the other two cities combined (54). That follows from room: NeurIPS describes Sydney as "the conference's main site, which has more capacity," and it got a similar share of tutorials (12 of 19).
23 workshops about agents
By our count, 23 of the 102 workshop titles contain "agent," "agents," or "agentic." That is nearly one in four, and it leaves out evaluation and safety workshops that cover agents without naming them in the title.
Seven more numbers from the selection process
21.5%, 23.6% and 25.4%
Acceptance rates differed by city. Sydney was the most selective at 21.5%, Atlanta came in at 23.6%, and Paris at 25.4%. NeurIPS says the gap comes from different submission counts and room availability at each venue, not different quality bars. Organizers stated a preferred city, and apart from a few workshops placed at their second choice, those preferences were met.
About 223 versus 110
Working backwards from those rates, Sydney received roughly 223 proposals, while Paris and Atlanta each received about 110. These are our estimates from the published acceptance counts and rates, not figures NeurIPS released. The three estimates add up to about 443, a little under the 454 valid proposals, because a few workshops were placed at their second-choice city. Either way, organizers wanted the main site about twice as much as either satellite.
353 of 1,021
The committee invited 1,021 reviewers and recruited 353 of them, about one in three. Every proposal got at least two reviews, which were summarized into a meta-review for the organizers.
8 organizers, 2 proposals
Two new limits applied this year. Each workshop could have at most eight organizers, and each person could appear on at most two proposals. NeurIPS granted five exceptions. The rules make it harder for a single group to stack the program.
19 of 62
Tutorials were even more competitive than workshops. NeurIPS accepted 19 of 62 tutorial proposals, about 31%, split 12 in Sydney, 4 in Paris and 3 in Atlanta. That is one fewer tutorial than the 20 run across San Diego and Mexico City in 2025.
16 competitions
NeurIPS selected 16 competitions for 2026, down from 19 across both 2025 sites. Some are attached to workshops and were still taking entries in October, including a Predictive AI Evaluation Competition in Sydney and an AI for Verifiable Coding track in Atlanta.
1 day all three cities overlap
December 12 is the only day when workshops run in Sydney, Atlanta and Paris at the same time. Because Sydney is 10 hours ahead of Paris and 16 ahead of Atlanta, Sydney's Saturday sessions are finished before Atlanta's begin. Anyone hoping to follow workshops in more than one city will be relying on recordings.
What the numbers mean if you are choosing a city
We grouped every workshop under one primary theme to see how the program splits by location. The tagging is ours, so treat the counts as a guide rather than an official breakdown.
Sydney is the default for breadth. It has the most workshops in almost every area, including 7 of the 9 workshops on robotics and world models, 4 of the 5 on interpretability, and 13 on science and health applications. If your team works across several areas, or needs the Expo and tutorials too, Sydney gives the most per trip.
Atlanta is the most concentrated. With 26 workshops, it is the smallest site, but almost a third of its titles mention agents, the highest share of the three. It also hosts two of the four workshops we tagged as evaluation-first, including the one on LLM judges and the one on interactive agents. Product teams focused on agents and evaluation get the densest program per day there.
Paris leans toward science, efficiency, and foundations. Four of the six workshops we tagged under efficiency and small models are in Paris, including LIGHT (deployable small foundation models), AXIOM (efficient deep learning) and AI for Chip Design. It also has the highest share of theory workshops of any site, and three of the eight we tagged under safety, security and privacy. Only 3 of its titles mention agents, which makes it the least agent-heavy city.
The acceptance-rate gap matters less than it looks. A workshop that made it into Sydney beat slightly tougher odds, but the difference between 21.5% and 25.4% came from room and demand, not from different standards. Choose the city by topic, not by selectivity.
How we counted
Workshop totals, city splits, acceptance rates, reviewer numbers and organizer rules come from the NeurIPS announcement of the 2026 workshops. Tutorial counts come from the 2026 tutorial announcement, and competition counts from the 2026 competitions announcement. The 2025 comparisons come from the NeurIPS 2025 fact sheet. The 2026 main-track acceptance rate is from third-party trackers (OpenAccept and csconfstats), not NeurIPS. The agent count is a title search across the official list of 102 workshops, and the theme groupings are our own, with each workshop assigned one primary theme. Implied proposals per city are our estimates from published acceptance counts and rates.